
Big data in agriculture
Fields contain much more useful data that one can imagine. Discover the growth potential and differences across fields with utilisation of automated algorithms for evaluation of crop performance, weak and strong zones and in-fields variability.

We provide software-as-a-service (SAAS) platform for automated identification of areas with differences in crop’s growth. The identification of spots with differences is based on analysis of vegetation index maps and weather data. Currently the insight analysis is available for:
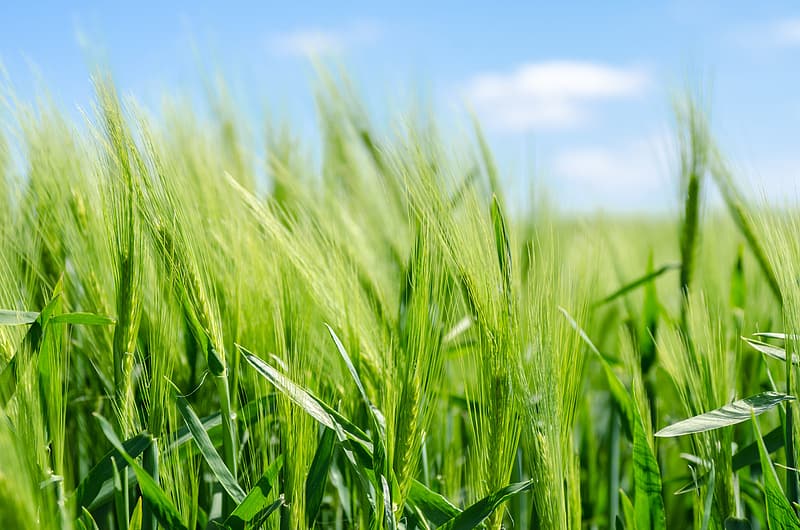
Wheat

Canola
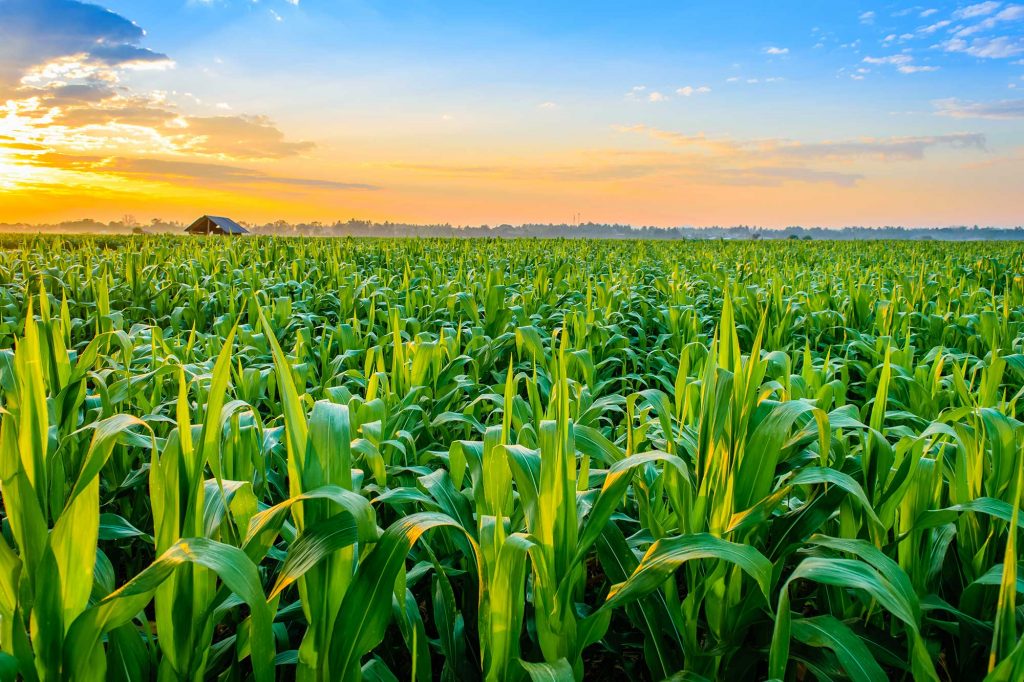
Corn
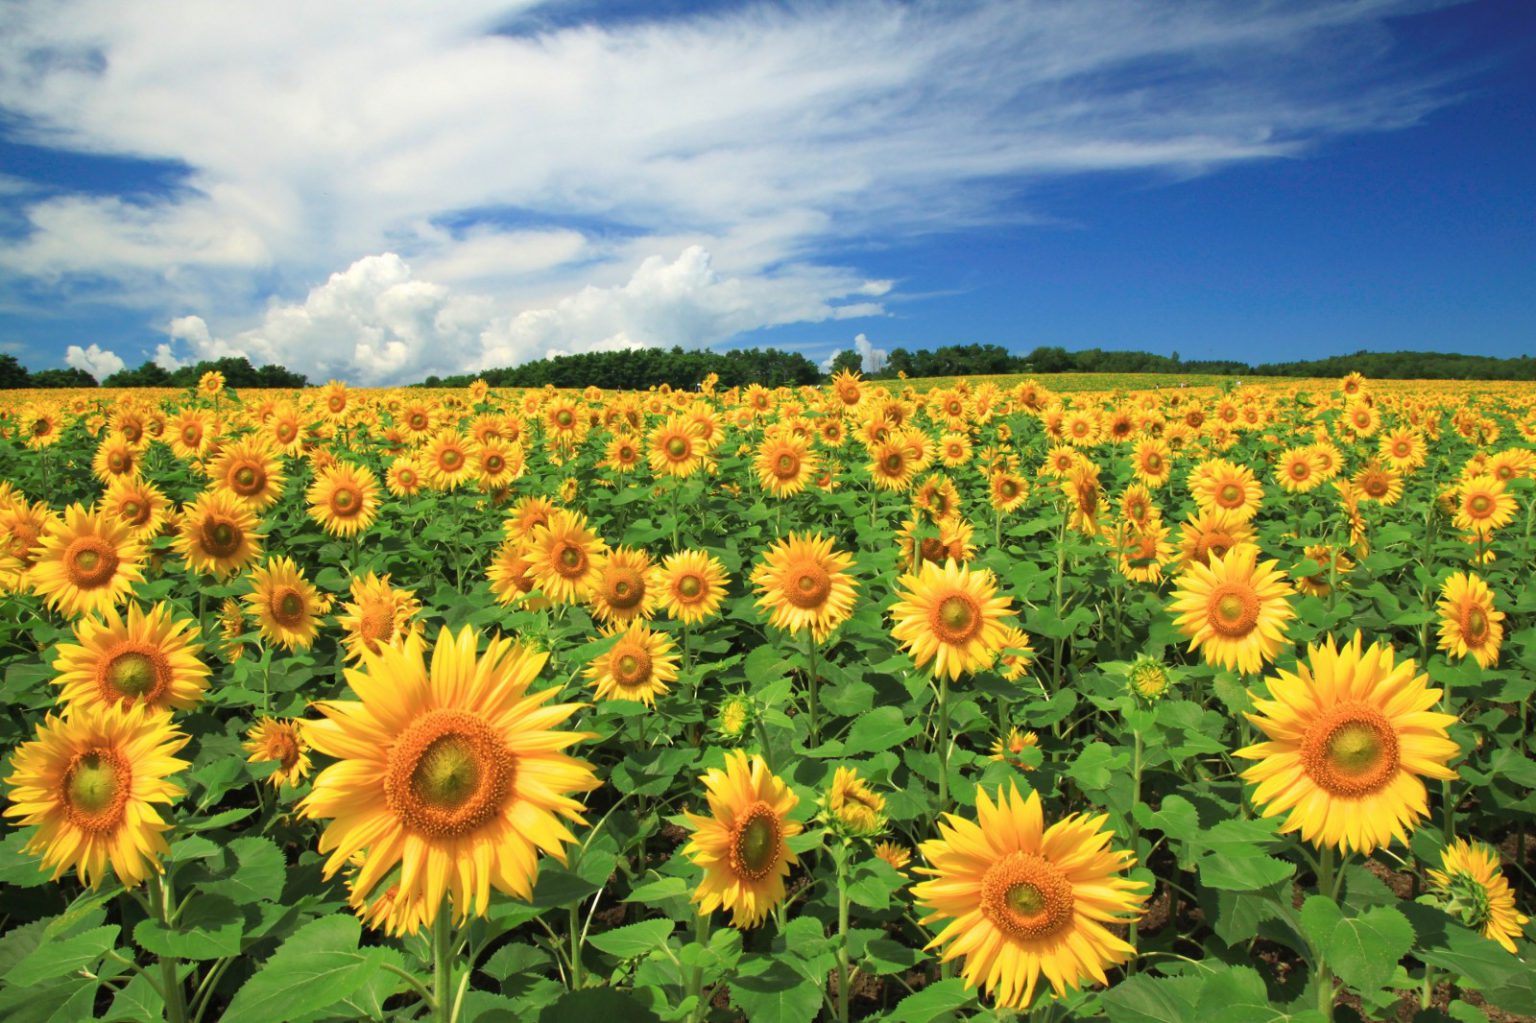
Sunflower
Vegetation maps
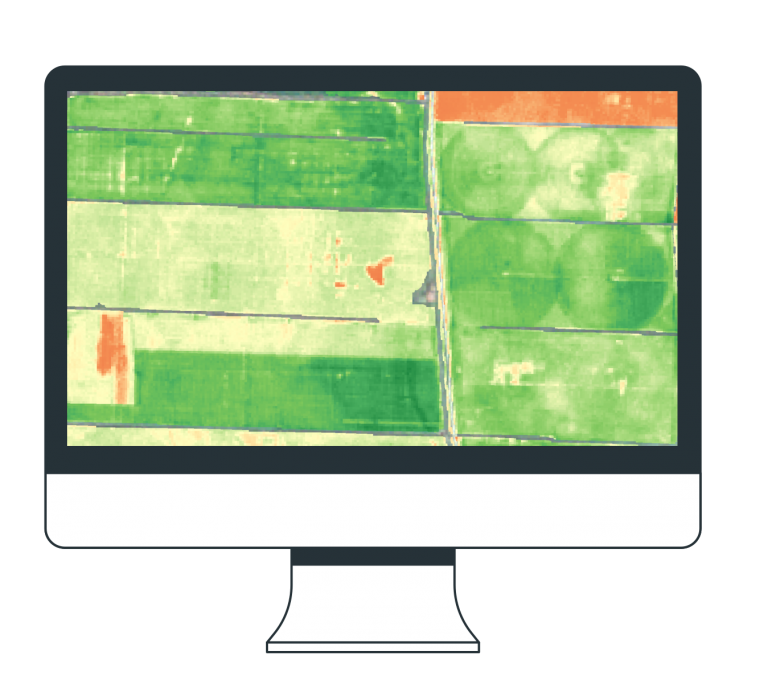
Vegetation index maps represent the the crop’s vitality in a statistically measurable way. Most common vegetation index is NDVI (Normalised differential vegetation index) and is based on calculation of reflected light in red and NIR spectrum of the light. In the later stages of crops development NDVI lacks sensitivity because of the bigger amount of biomass on the fields, in that case RedEdge and Modified Triangular Vegetation Index (MTVI2) are used due to their correlation with chlorophyll content.
Weather data
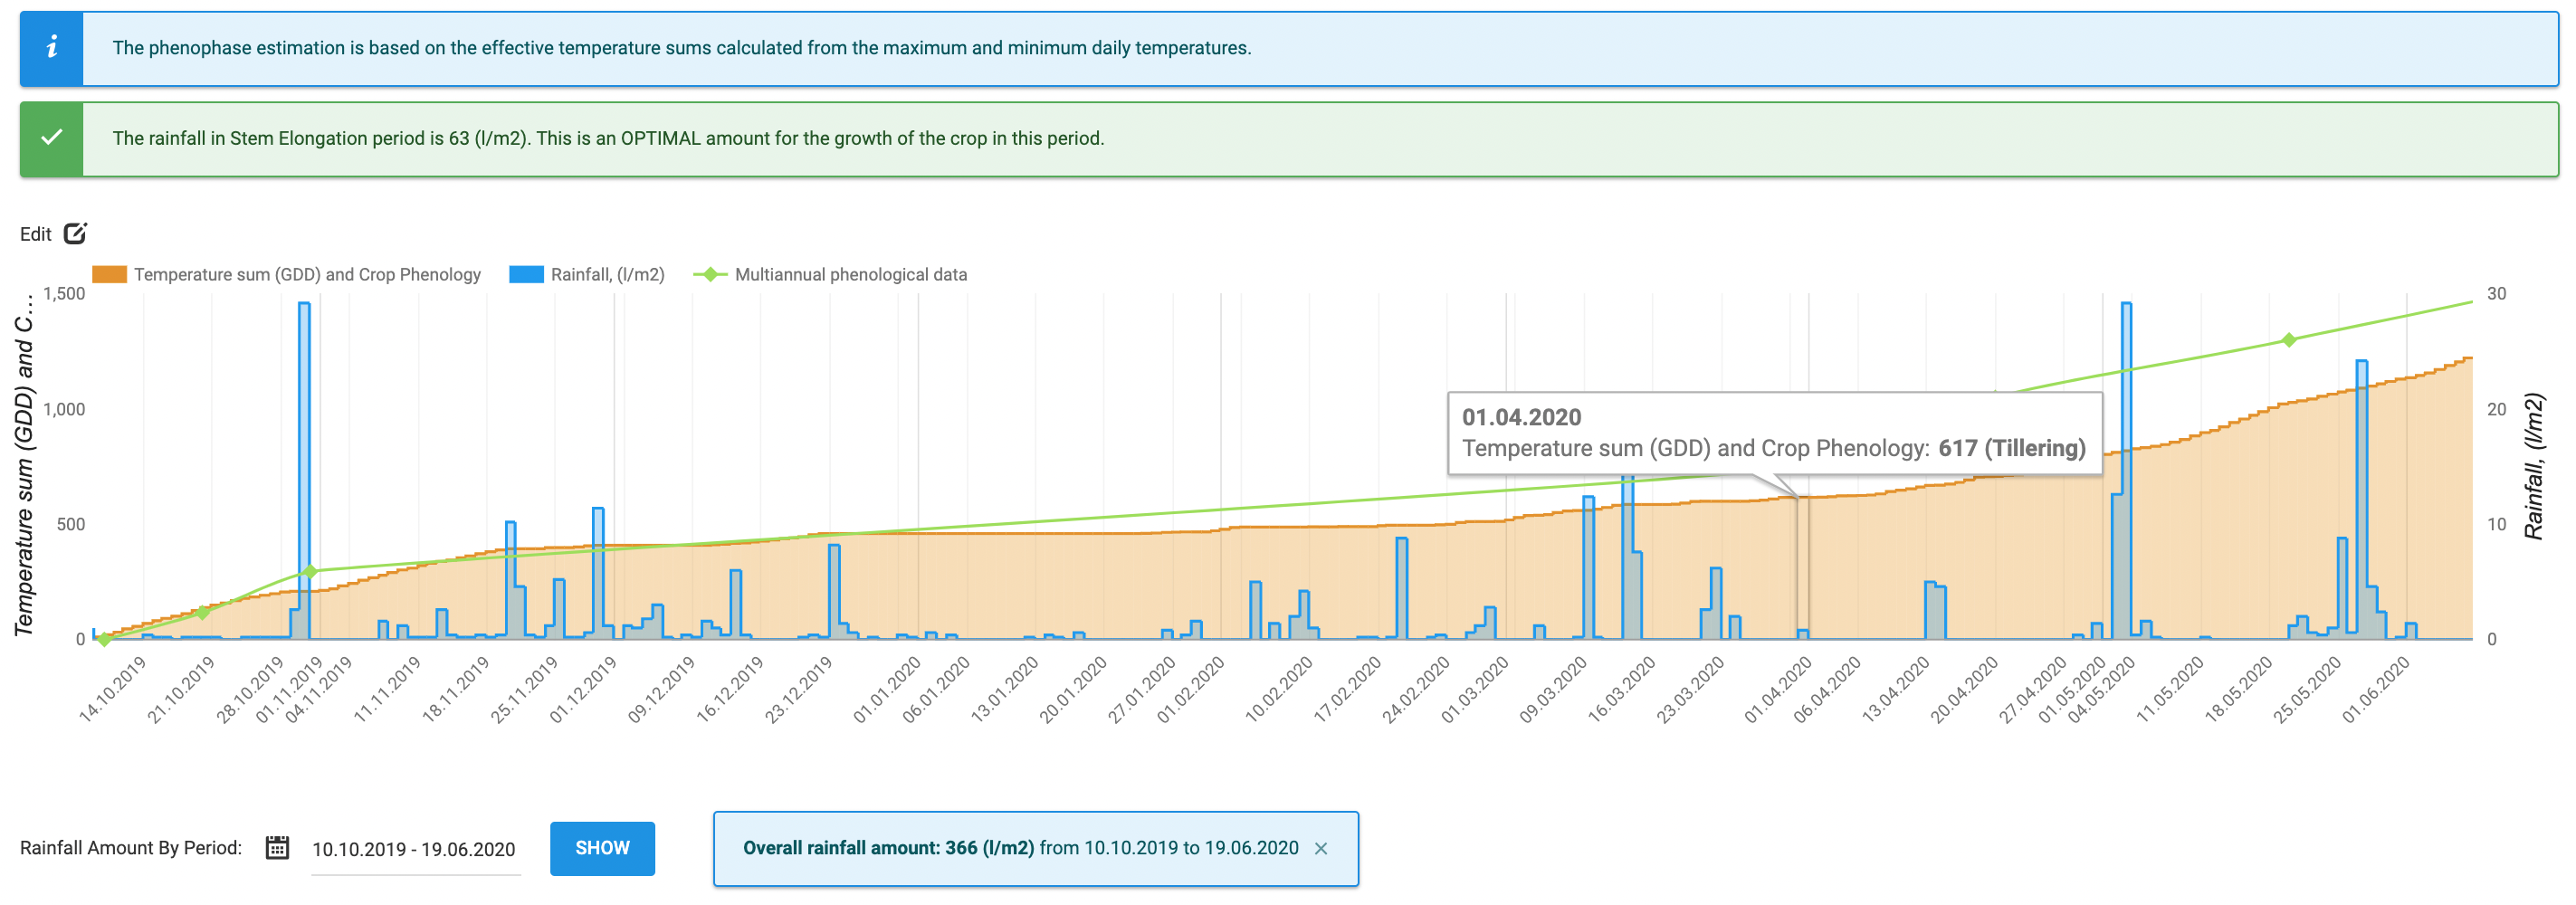
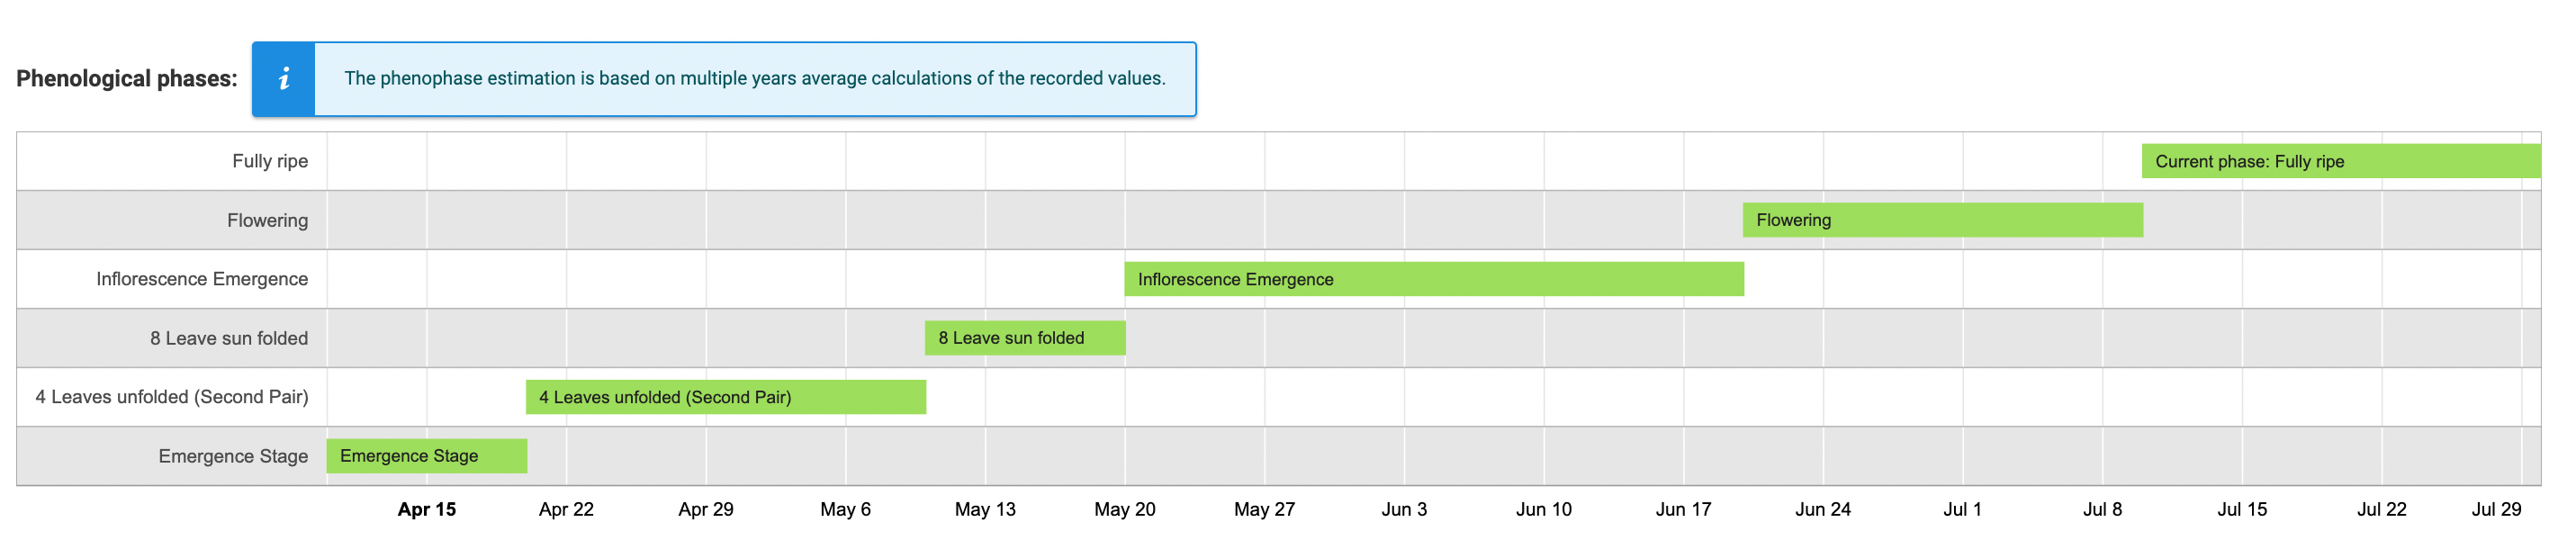
Crop development is directly connected with weather conditions. The main growth factors are temperature and rainfall. Development of crop diseases is mainly caused by soil moisture, air humidity and wind speed in specific growth stages. The software platform supports various sources of weather information – local sensor stations or globally available services for current and historical weather data. The advantage of physical sensor station is in the accuracy of sensed values and the bigger frequency of measurements.

Field analysis and warnings
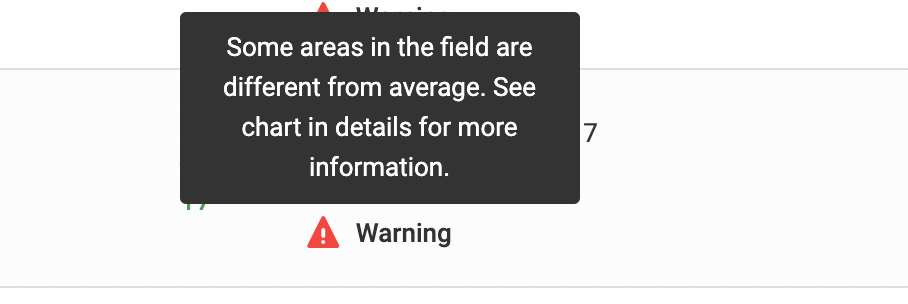
Identified areas with differences in crop growth
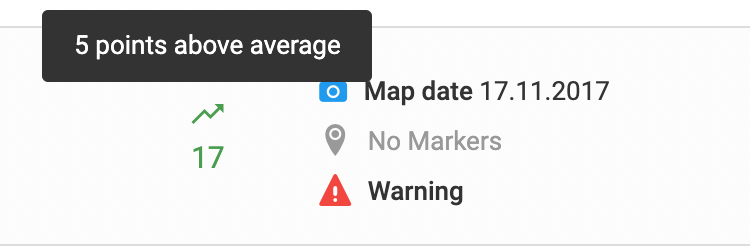
Field is performing better than other fields with same crop
Currently the service is available upon request.
Integration with 3rd party applications via API is possible as well. For more information please